Drawing
The Screen
Our "Screen" in GotoJSE is the area in the browser that we can draw to, and is made up of hundreds of "pixels".
As we feed our program with more drawing commands, these pixels will change to match what we've asked the computer to draw.
From the start, GotoJSE's screen is 640 pixels wide from left to right and 480 pixels high from top to bottom.
We can use the Plot command to draw dots on the screen within this area.
// This dot appears near the top left
//  10 pixels from the left of the screen,
//  and 20 pixels from the top.

Plot 10,20
There are two values that we should give to a Plot command.
The first is the distance from the left of the screen that we want the plot to happen.
The second is the distance from the top of the screen.
We call these the X and Y "co-ordinates".

We plot using co-ordinates
We always do X first followed by Y.
A Perfect Plot
With the power of the Plot command, we can start to draw pictures onto our screen.
We already know that the screen is 640 pixels wide and 480 pixels tall.
If we halve each of these, we get 320 and 240 as being the very middle of our screen.
Let's start by plotting a dot in the middle of the screen.
// Draw a dot in the middle of the screen
Plot 320,240
That's awesome! Right in the middle!
Now let's put some more dots around the middle. Above it, below it, left and right
We can use maths to add and subtract from the middle point.
// Draw a dot in the middle of the screen
Plot 320,240

// Draw four dots surrounding the middle
Plot 320 + 50 , 240    // Add 50 to the X
Plot 320 , 240 + 50    // Add 50 to the Y

Plot 320 - 50 , 240    // Take away 50 from X
Plot 320 , 240 - 50    // Take away 50 from Y

50 left, 50 right, 50 up and 50 down.
Maths and Numbers will let us do lots of things in our programs
Numbers are fun!
Join the Dots
We've seen that the Plot command takes two parameters (values) to draw a point on the screen.
Previously we would have drawn two dots like this.
// Draw two points
Plot 320 + 50 , 240    // Add 50 to the X
Plot 320 - 50 , 240    // Take away 50 from X
This works because the Plot command uses X and Y as its values.
Now let's try using the Line command to draw a line!
The Line command, uses two pairs of values.
X1 and Y1 tell it where the first point should be, and then a second pair of X2 and Y2 values to tell it where the other point should be.
The computer will then draw a straight line between these two points.
// Draw a line between two points.

Line 320 + 50 , 240   ,  320 - 50 , 240
Notice that these are the same co-ordinates as we previously plotted, only now they've been joined up by the line.
The line command will draw lines between any pairs of points that we give it.
Line 320 + 50 , 240   ,  320 - 50 , 240
Line 320 , 240 - 50  ,  320 , 240 + 50
Line 320 + 50 , 240 + 50  ,  320 - 50 , 240 - 50
Line 320 - 50 , 240 + 50  ,  320 + 50 , 240 - 50
Just remember that the points are in pairs of X and Y.
They work the same as the Plot command, but now they work together in pairs to make a line.
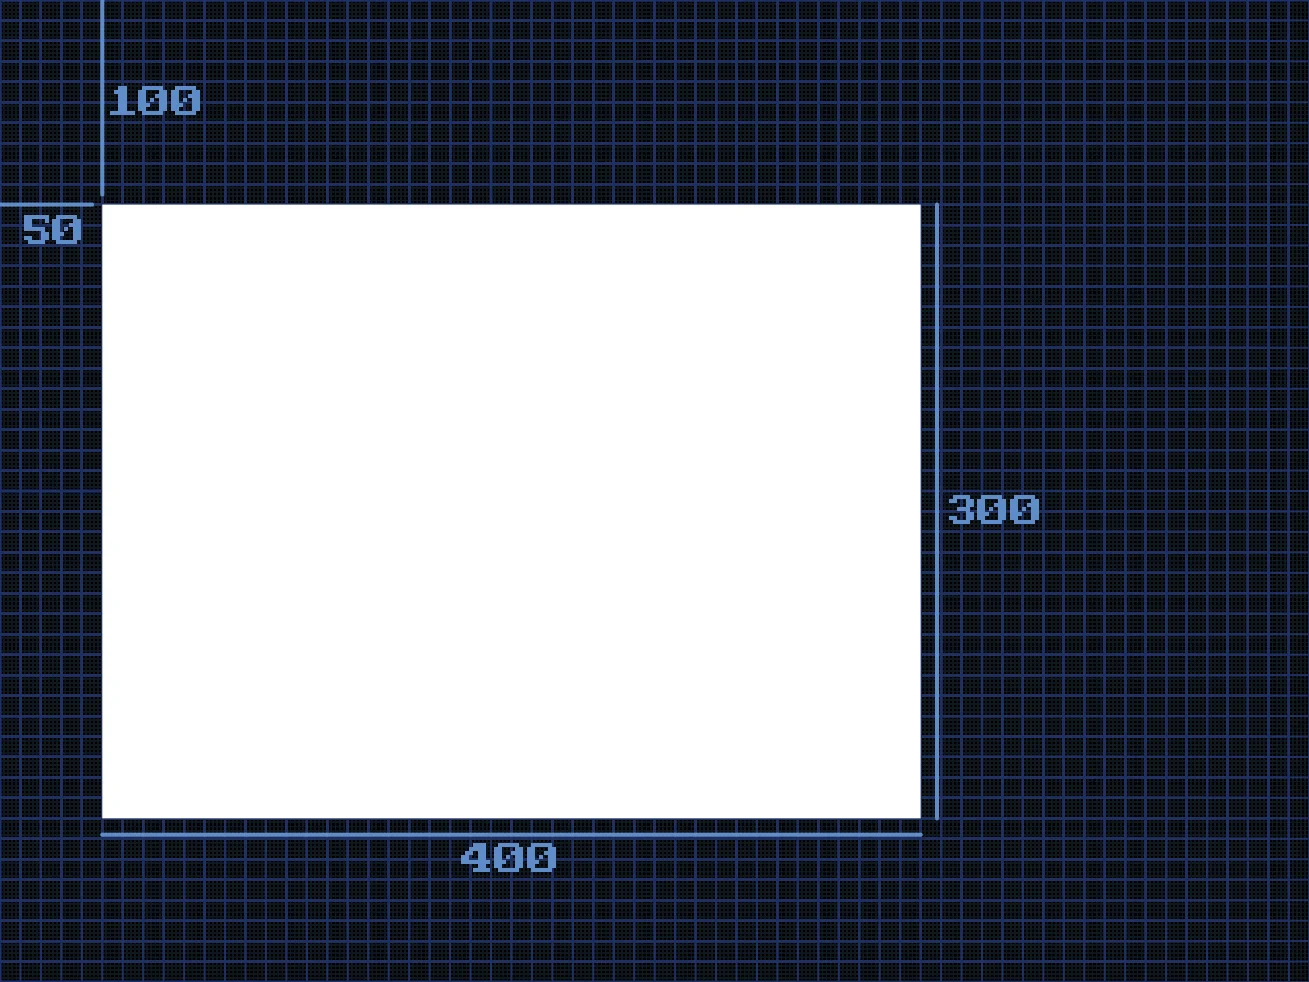
Width and Height
Rect 50,100,400,300
Rect (short for Rectangle) takes four values like Line did, but this time the pairs are slightly different.
The first two values are the X and Y "home" of our rectangle. This is the starting point where we begin drawing the rectangle.
The second pair of values, however, are now Width and Height. These numbers tell us how BIG the rectangle should be. Width is how wide the rectangle is (going across), and Height is how tall it is (going down).
The Rect command on its own will paint a filled rectangle.
If we'd prefer the rectangle to be a set of lines, we can instead use the DrawRect command.
This command uses the same values as its brother, but tells the computer to only draw the outline, not fill it in.
DrawRect 50,100,400,300
Lamps of Colour
So far, everything we've drawn has been White.
Let's spice things up with a bit of colour.
In GotoJSE, we use three values for a colour. Red, Green and Blue.
Think of these like three lamps. And each lamp can be powered from 0 (off) all the way to 255 (full!)
If we turn the red lamp all the way to full, and the green and blue lamps off, then all we get is Red.
We can also mix the lamps together to get more colours.
If we mix Red and Green, we get Yellow. Green and Blue gives a light blue (Cyan) colour. Blue and Red makes Pink.

Full colours blended together.
Working in Colour
There's also lots of other colours that we can make if we change the three values.
Once we've set our colour, any drawing commands will draw in that colour.
We can Set a Colour using the simple command SetCol, (short for SetColour) with the Red, Green and Blue values.
SetCol 255, 0, 0
Print "Red"

SetCol 0, 255, 0
Print "Green"

SetCol 0, 0, 255
Print "Blue"

SetCol 255, 255, 0
Print "Yellow"

SetCol 0, 255, 255
Print "Cyan"

Print "Still Cyan"

SetCol 255, 0, 255
Print "Pink"

SetCol 255, 255, 255
Print "White"
Notice that the colour stays how it is, until we change it.
Can you change the colour values to match their names?
SetCol 255,255,255
Print "Orange"

SetCol 255,255,255
Print "Lime Green"

SetCol 255,255,255
Print "Pastel Pink"

SetCol 255,255,255
Print "Dark Blue"

SetCol 255,255,255
Print "Vibrant Yellow"

SetCol 255,255,255
Print "Brown"
Can you finish the drawing?
// Head
DrawRect 80,60,40,40
// Body
Line 100,100,100,200
// Left Arm
Line 100,110,40,150
// Right Leg
Line 100,200,160,250